About Audiograms
Submitted by AAHstaff on Fri, 11/05/2010 - 16:29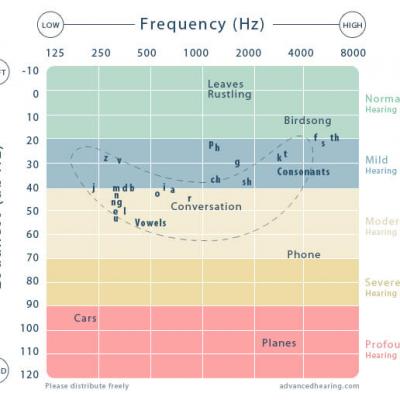
Do you suspect that you need hearing aids? Maybe it's time to take a hearing test and find out.
Do you suspect that you need hearing aids? Maybe it's time to take a hearing test and find out.
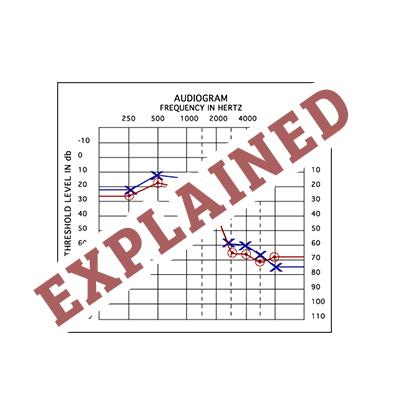
Audiograms (or hearing tests) can be a bit confusing at first. You have a chart with Frequency along the top and Loudness down the side. You have a series of dots and lines across the graph. Occasionally, there will be notes written across the page. What does it all mean? Let's take a look.